New GeoMesa tutorial: Aggregating and Visualizing Data
Earlier this summer, the GA-CCRi blog entry GeoMesa analytics in a Jupyter notebook introduced the use of Jupyter notebooks with Scala and GeoMesa to do Apache Spark analytics and geospatial visualization. As the blog entry said, it only scratched the surface of the kinds of geospatial analytics that you can do with GeoMesa and Spark.
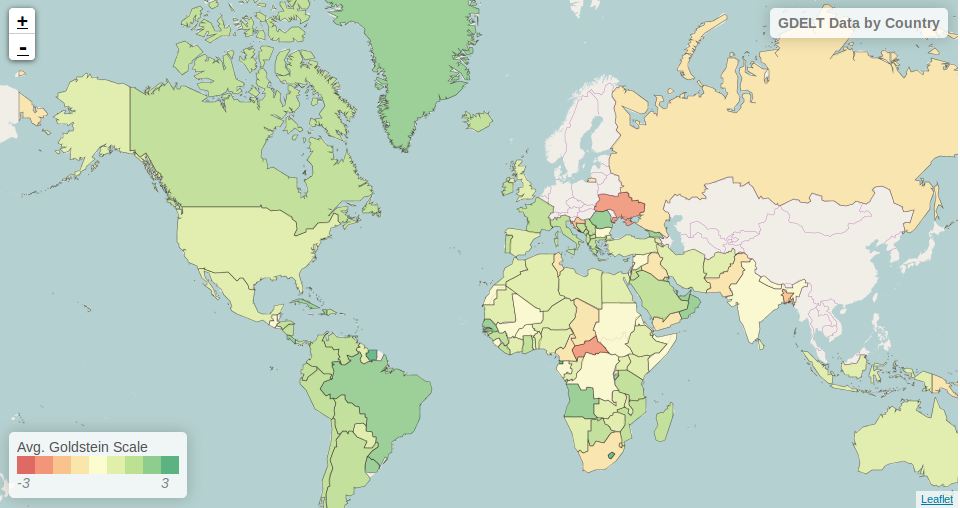
A new tutorial on the GeoMesa web site titled Aggregating and Visualizing Data goes into greater detail about how you can use GeoMesa and Spark together to perform analytics and visualize the results in a Jupyter notebook. The tutorial describes how to create a “shallow join” that imposes a small covering set of geospatial data onto a much larger set of data.To demonstrate this, it groups GDELT data about news by country and computes each country’s stability using the Goldstein Scale as calculated from the relevant news stories. It then displays the average Goldstein score for each country using the color-coded map of the world. (Spoiler alert: for the time period represented by the sample data set’s news stories, the Central African Republic and Ukraine are the least stable countries.)
Each of the GDELT news stories has metadata about the specific location where it takes place, but no metadata about the country, so the tutorial shows how to calculate the country where each news story takes place by using a shapefile of country borders. Grouping the stories using other shapefiles (for example, shapefiles that outline each area’s predominant religious or political affiliations) could help the same data set reveal new insights.
In addition to linking to a static version of the complete Jupyter notebook in GitHub, the tutorial explains what you need to run the code yourself. This means that you can not only reproduce the tutorial’s example but also, because it is in a Jupyter notebook, you can experiment with tweaks to different parts of the code and immediately see the effect.
All in all, the tutorial shows how Using GeoMesa with a Jupyter notebook is a great way to get hands-on experience with the powerful combination of GeoMesa and Apache Spark.